Financial Performance
Balance Sheet Analysis
Key Balance Sheet Indicators
|
Main Balance Sheet Items, KZT million |
2021 |
2022 |
2023 |
2024 |
Change 2024/2023,% |
|---|---|---|---|---|---|
|
Assets |
2,804,120 |
3,440,022 |
3,996,059 |
4,279,621 |
107 |
|
Loans and advances to customers |
1,999,327 |
2,877,314 |
3,100,990 |
3,379,713 |
109 |
|
Investment securities measured at fair value through other comprehensive income |
102,855 |
56,032 |
51,517 |
40,476 |
79 |
|
Cash and cash equivalents |
595,066 |
327,515 |
590,920 |
568,660 |
96 |
|
Investment securities measured at amortized cost |
84,024 |
82,293 |
113,758 |
186,442 |
164 |
|
Other assets |
22,848 |
96,868 |
138,874 |
104,330 |
75 |
|
Liabilities |
2,423,017 |
2,977,760 |
3,400,790 |
3,570,047 |
105 |
|
Customer accounts |
1,898,429 |
2,300,445 |
2 660 378 |
2,667,525 |
100 |
|
Borrowed funds |
78,910 |
108,543 |
133,007 |
158,162 |
119 |
|
Debt securities issued |
191,456 |
193,469 |
195,787 |
417,668 |
213 |
|
Other liabilities |
254,222 |
375,303 |
411,618 |
326,692 |
79 |
|
Equity |
381,103 |
462,261 |
595,269 |
709,574 |
119 |
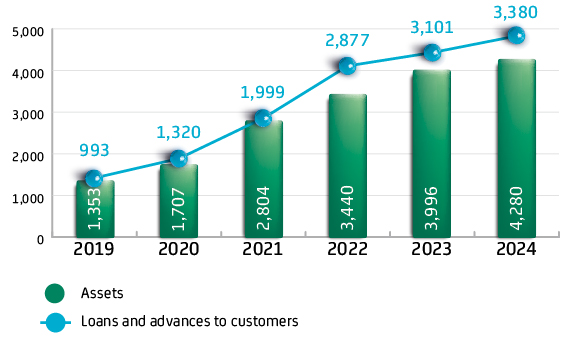
In 2024, the Bank’s total assets increased by 7 percent, or KZT 284 billion, reaching nearly KZT 4 trillion.
The share of loans overdue by more than 90 days stood at 0.12 percent at the end of 2024 (0.10 percent by balance sheet value), which is the lowest rate in the banking system of Kazakhstan.
Investments in securities accounted for 1 percent of total assets in 2024, while cash and cash equivalents made up 13 percent. The Bank’s investment activity focuses on effective management of available liquidity with the primary goal of preserving the value of its assets. As of the end of 2023, the Bank’s financial assets totaled KZT 781 billion.
The Bank’s total liabilities reached KZT 3.6 trillion by year-end 2024, marking a 5 percent increase or KZT 169 billion. Customer funds accounted for 75 percent of total liabilities. As of the end of the reporting year, the volume of customer accounts stood at KZT 2,666 billion.
The Bank maintains a low level of debt burden. Borrowed funds made up 4 percent of total liabilities at year-end 2024, and issued debt securities accounted for 12 percent.
The volume of borrowed funds grew by KZT 25 billion or 19 percent in 2024, primarily due to financing received within the framework of state development programs.
Assets Dynamics, KZT bln
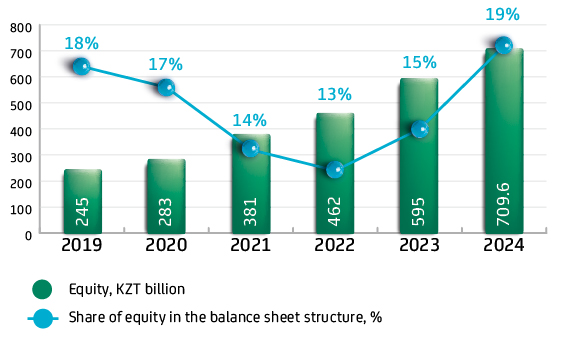
Equity Dynamics
Liabilities Dynamics, KZT bln
In 2024, the Bank’s equity increased by 19 % and reached KZT 709.6 billion. Equity accounted for 17 % of the Bank’s balance sheet structure, indicating a high level of financial stability and independence.
The Bank continues to maintain a strong liquidity position and capital adequacy, significantly exceeding regulatory requirements. This performance is the result of effective asset management practices. Prudential capital adequacy ratios k1, k1-2, and k2 stood at 39 % in 2024, more than four times higher than the minimum regulatory thresholds.
|
Key Indicators |
2021 |
2022 |
2023 |
2024 |
Regulatory Minimum |
|---|---|---|---|---|---|
|
k1 ratio |
34.6 % |
28.7 % |
34.8 % |
39.0 % |
not less than 5.5 % |
|
k1-2 ratio |
34.6 % |
28.7 % |
34.8 % |
39.0 % |
not less than 6.5 % |
|
k2 ratio |
34.6 % |
28.7 % |
34.8 % |
39.0 % |
not less than 8.0 % |
The Bank’s annual profit increased and amounted to KZT 120.8 billion. The Bank continues to demonstrate strong profitability indicators, with a return on equity (ROE) of 18.51 % and a return on assets (ROA) of 2.92 % in 2024.
Target vs. Actual Performance Analysis
Comparison of Target and Actual Key Performance Indicators
|
Indicator |
UOM |
Actual, 2021 |
Actual, 2022 |
Actual, 2023 |
Target, 2024 |
Actual, 2024 |
Performance, % |
|---|---|---|---|---|---|---|---|
|
Assets |
KZT million |
2,804,119 |
3,440,105 |
3,996,059 |
4,317,566 |
4,279,621 |
99 |
|
Equity |
KZT million |
381,103 |
462,261 |
595,269 |
697,806 |
709,574 |
102 |
|
Liabilities |
KZT million |
2,423,017 |
2,997,843 |
3,400,790 |
3,619,760 |
3,570,047 |
99 |
|
Revenue |
KZT million |
216,048 |
281,470 |
359,182 |
355,259 |
369,177 |
104 |
|
Expenses |
KZT million |
150,293 |
185,435 |
211,654 |
223,463 |
248,384 |
111 |
|
Net profit |
KZT million |
65,755 |
96,035 |
147,528 |
107,566 |
120,793 |
112 |
|
ROE |
% |
19.81 |
22.77 |
27.90 |
16.64 |
18.51 |
111 |
|
ROA |
% |
2.91 |
3.08 |
3.97 |
2.59 |
2.92 |
113 |
|
Deposit base |
KZT million |
1,509,092 |
2,140,681 |
2,362,586 |
2,349,623 |
2,423,853 |
103 |
|
Loan portfolio |
KZT million |
2,083,795 |
2,968,315 |
3,202,303 |
3,381,812 |
3,379,713 |
99.9 |
At the end of 2024, the Bank demonstrated growth in key performance indicators and exceeded several of its planned targets. This reflects the expanding scale of the Bank’s operations and the growing interest of the population in the housing savings system. As a result, the Bank continues to maintain strong profitability indicators, which remained above target values. Both assets and liabilities also performed slightly above their target levels.
The visualization of the Bank’s future development scenario, taking into account expected inflows from budget loans, market borrowings, financial instruments, deposit base growth, and profitability, along with outflows for program implementation, operational expenses, and strategic development, is integrated into the financial model approved within the Bank’s Business Model.
The Bank’s investment strategy in financial instruments remains conservative and is primarily focused on placing temporarily available cash in secure financial instruments.
These temporary funds are formed from stable and alternative sources of funding, as well as from balances held in customer current accounts.
Ensuring the Bank’s Sustainable Development

The Bank is committed to balancing the interests of business and society and aligning its economic, environmental, and social goals to ensure long-term sustainable development. The Bank integrates sustainability principles, as outlined by international sustainability standards, into its management system, development strategy, and core operational processes.
The Bank’s risk and capital management system is an integral part of its strategy, aimed at ensuring sustainable development through informed decision-making in uncertain environments. This enhances the effectiveness and efficiency of decisions, reduces losses, and maximizes profitability.
In managing risks, the Bank employs various approaches in accordance with the requirements of the National Bank of the Republic of Kazakhstan, as a participant in the national financial system. These include:
- the three lines of defense model;
- development of the Bank’s risk appetite strategy;
- capital adequacy assessment;
- liquidity adequacy assessment;
- stress testing of the Bank’s key financial indicators;
- implementation of a management reporting system to ensure timely communication of risk indicators to the Bank’s authorized bodies.
To successfully implement its strategy, the Bank regularly analyzes key risks that may affect the achievement of strategic goals and financial stability, and develops corresponding risk mitigation measures. In the reporting year, as in previous periods, the Bank continues to maintain sufficient levels of liquidity and capital, which significantly exceed the regulator’s requirements.
The Bank maintains its financial stability by managing its financial operations in alignment with its strategic objectives. Through the effective implementation of state-funded and internally financed programs over the past five years, the Bank has achieved consistent annual growth in revenue and net profit.
The Bank also focuses its efforts on building a highly efficient model of human resource management, creating a team of like-minded people capable of achieving the Bank’s strategic goals and objectives. The Bank, in its turn, provides its employees with extensive opportunities for training and development, enhancing their skills and competences. In its activities, the Bank applies a modern system of selection, recruitment, training, career planning and effective motivation of personnel using key performance indicators (KPIs) assessment. The KPI assessment system is structured through the cascading KPIs from senior management down to administrative staff.